

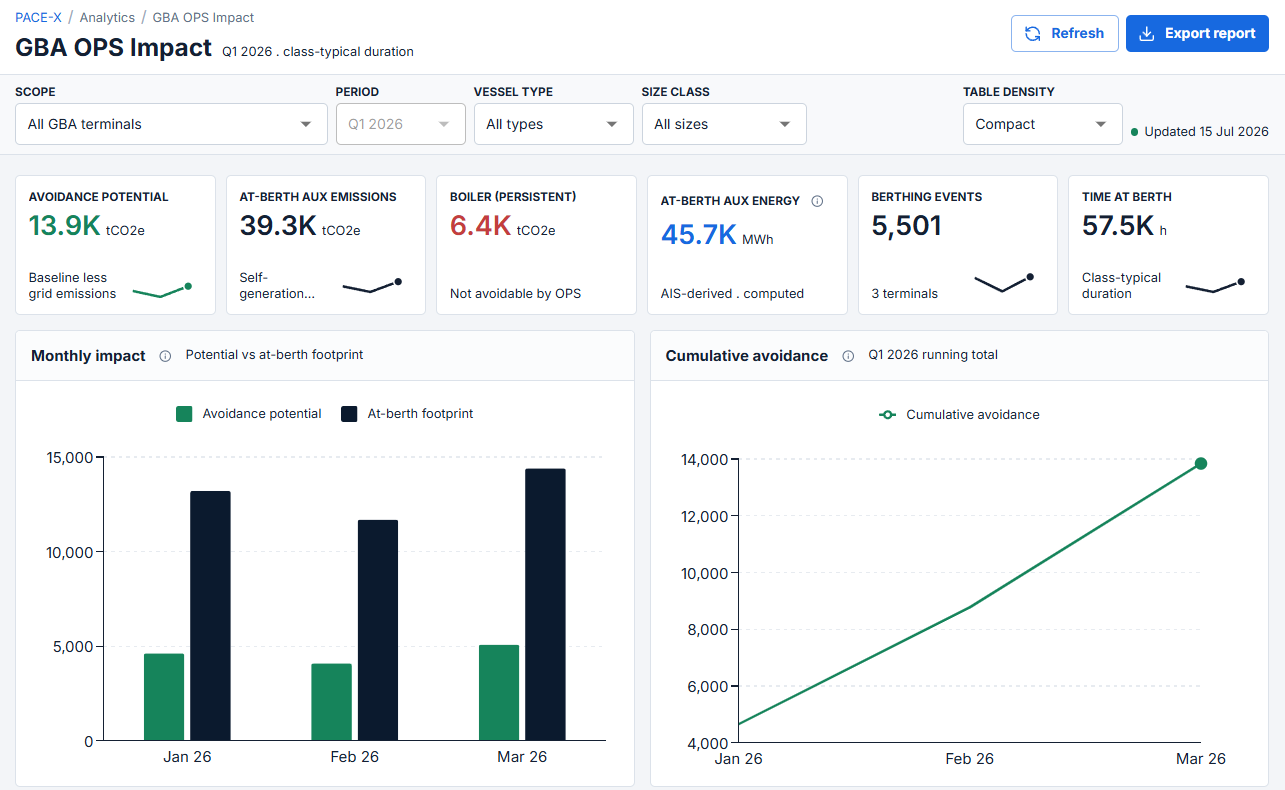
13,861 tonnes of avoidable CO₂e across three Greater Bay Area terminals in a single quarter — measured call by call, and split three ways: a greenfield shore-power case, a utilisation gap, and a residual no honest model should hide.
PACE-X — a Greensee × Climate Change Ventures joint venture · Q1 2026 build
The Quarter, in Numbers a Port Director Can Act On
Every figure computed to the IMO Fourth GHG Study methodology and traceable to the single berth call.
The PACE-X dashboard’s Q1 2026 build is live: a full quarter of at-berth emissions across Hong Kong, Shenzhen and Guangzhou, reconstructed from the AIS signal every ship already broadcasts. For a port authority or terminal operator this is not an environmental report — it is the measured baseline that OPS investment cases, berth incentive schemes and expansion-finance applications are built on.
Carbon Is Becoming a Line Item at the Berth
Green port incentives, differentiated dues, sustainability-linked finance and, in time, carbon trading all rest on the same prerequisite: numbers that survive scrutiny.
Most ports cannot yet produce them. At-berth emissions are typically estimated from periodic surveys, self-reported returns, or fleet-average factors applied to throughput — adequate for a sustainability report, not for setting a tariff, sizing an OPS investment, or defending a funding application. An average cannot say which vessel, at which berth, on which day.
PACE-X closes that gap: auxiliary energy and emissions derived for each individual berth call — 5,501 of them this quarter, each carrying its own avoidance figure. Nothing hides inside an average.
One Region, Three Business Cases
The terminal comparison is where the Q1 build earns its keep. Three terminals, one methodology — three different answers to “where does the money go?”
| Terminal | OPS status | Calls | Aux energy | Avoidable | Grid kgCO₂e/kWh |
|---|---|---|---|---|---|
| Hong Kong · HKHKG | No OPS today | 4,213 | 31,110 MWh | 10,920 t · 79% | 0.370 |
| Shenzhen · CNSZX | OPS-equipped | 930 | 13,122 MWh | 2,637 t | 0.520 |
| Guangzhou · CNNSA | OPS-equipped | 358 | 1,511 MWh | 304 t | 0.520 |
Hong Kong: the region’s biggest shore-power case — and it is greenfield
Hong Kong holds 79% of the GBA’s avoidance potential and has no OPS at the quay. Its advantage is structural: the cleanest grid in the comparison (0.370 vs 0.520 kgCO₂e/kWh), so every megawatt-hour drawn from shore retires more carbon than it would next door. For an authority weighing electrification CAPEX — or assembling the evidence pack for expansion finance — this is the rare case where the demand behind the investment is already measured, vessel by vessel, before a single cable is laid.
Shenzhen and Guangzhou: the hardware exists — the gap is utilisation
The two OPS-equipped terminals still show 2,941 tCO₂e of uncaptured avoidance in the quarter. That is not a construction problem; it is a connection problem — and it calls for a different instrument: berth-level incentives, connection targets in port policy, and per-call billing that rewards vessels which plug in. The dashboard prices exactly that gap, call by call, which is what makes the incentive scheme administrable rather than aspirational.
The residual: what OPS honestly cannot fix
6,437 tCO₂e of the quarter’s footprint is persistent boiler load that shore power does not displace. PACE-X states it rather than folding it into a headline. A baseline that admits its limits is precisely the kind a lender, a regulator or a board can rely on — and the number that keeps an OPS business case from being oversold.
What a Port Can Do With an Itemised Number
The difference between an averaged figure and an itemised one is the difference between describing a problem and financing its solution. With per-call attribution, a port or terminal can:
Dimension shore-power investment on actual auxiliary load per berth, not projected throughput.
Take a measured, auditable avoidance baseline into expansion-finance and green-finance applications, where surveyed estimates do not survive due diligence.
Differentiate dues or priority berthing by measured at-berth performance, defended by a per-call audit trail.
Give regulators an IMO-aligned, transparent methodology instead of negotiating over estimates.
An Honest Roadmap
The sequence matters. Measure comes before verify, and verify comes before trade — because every downstream financial instrument inherits the credibility of the measurement underneath it.
Why the Numbers Are Bankable
Each figure is labelled at source, aligned to the recognised IMO Fourth GHG Study methodology, and traceable down to the single berth call — vessel, arrival, departure, hours alongside, auxiliary energy, avoidable tonnes. The derivation is physical, from vessel-specific loads and each terminal’s own grid intensity — which is why the model can also say what is not avoidable.
That is what makes one dataset serviceable to every side of the table: the terminal shaping an incentive, the authority sizing OPS, the regulator setting policy, and the financier underwriting the investment. One trusted dataset, four users, no reconciliation dispute.
An averaged number describes a port’s problem. An itemised number funds its solution. Stop estimating your emissions. Start monetising them.
Get your port calculated
Sizing shore power, designing berth incentives, or assembling an expansion-finance evidence pack — we will calculate your at-berth baseline and walk you through it, itemised to the berth call.
Request your port’s baseline →or write to contact@pacex.ai
Methodology: figures are the Q1 2026 build (dashboard updated 15 July 2026): AIS-derived at-berth auxiliary energy and emissions across three Greater Bay Area terminals, computed per the IMO Fourth GHG Study methodology using class-typical berth durations; avoidance potential is the self-generation baseline less grid emissions, assuming calling vessels connect at the berth; persistent boiler load is reported separately as not avoidable by OPS. PACE-X is a joint venture of Greensee and Climate Change Ventures.
